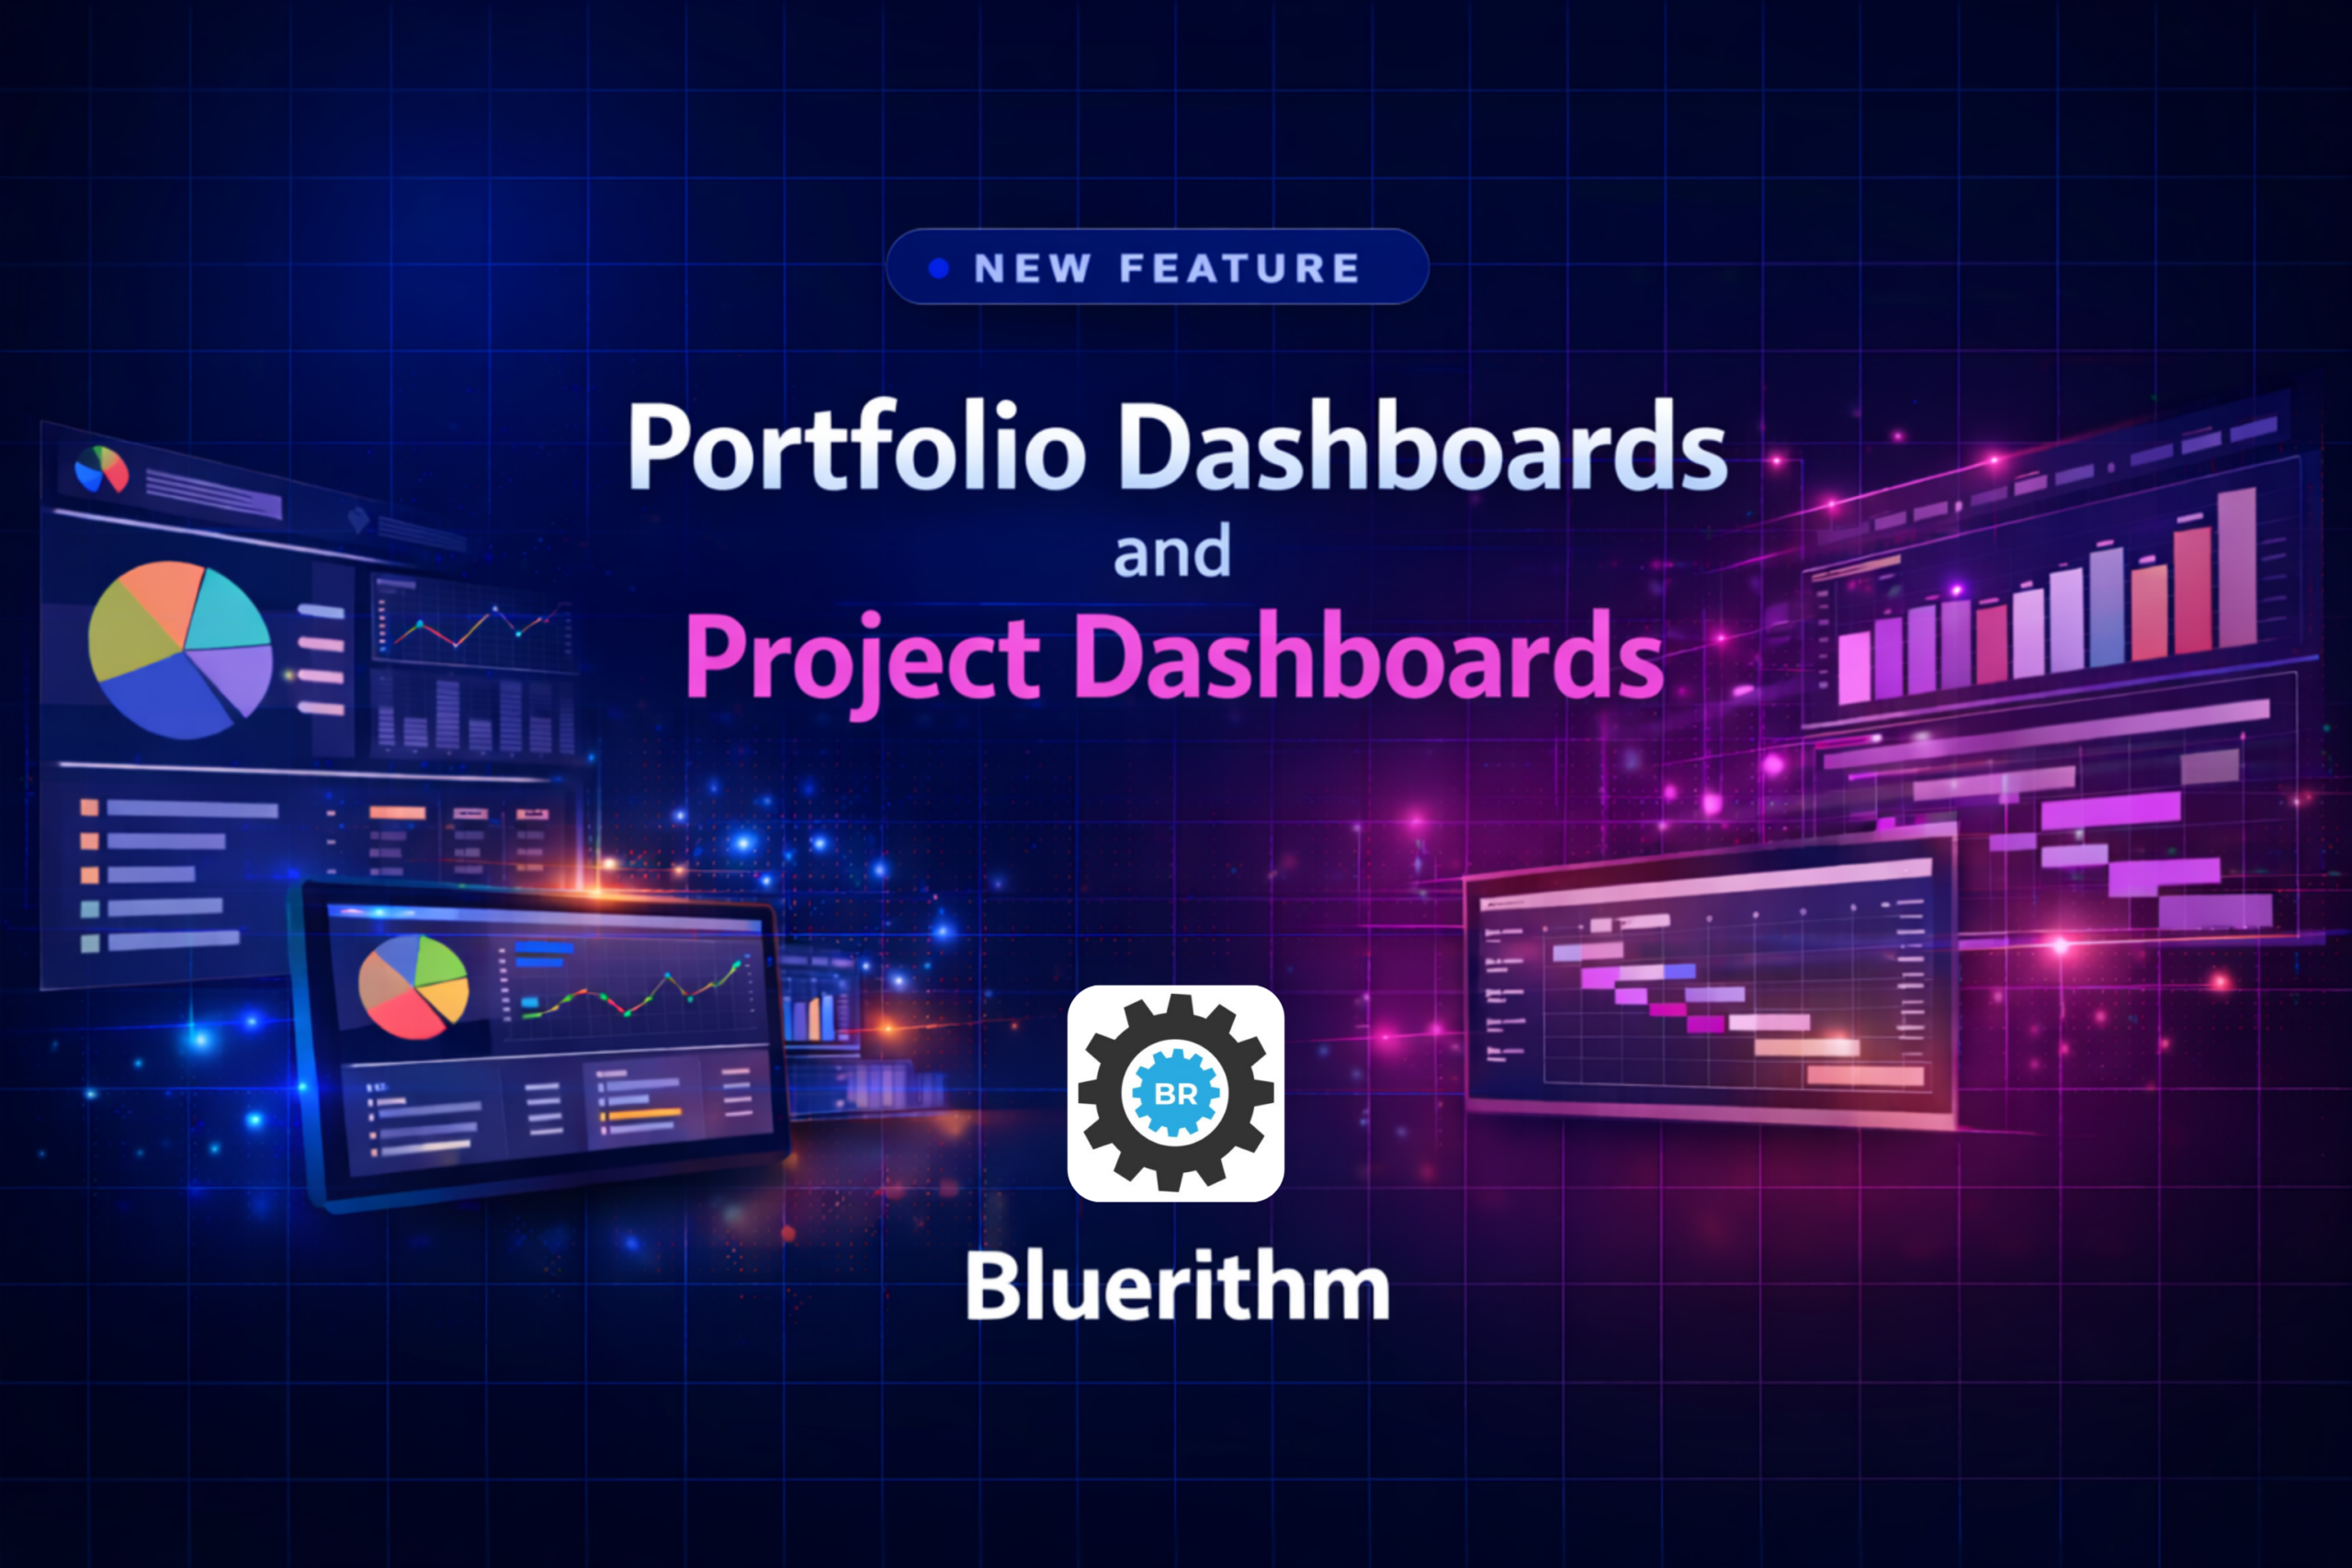
Bluerithm’s new dashboards give commissioning teams a faster, clearer way to understand project status, performance, and milestones—whether they need a detailed view of one job or a high-level rollup across many. Built around a drag-and-drop experience, the new dashboard tools let users create personalized views, customize charts, and share insights more easily with leadership and clients.
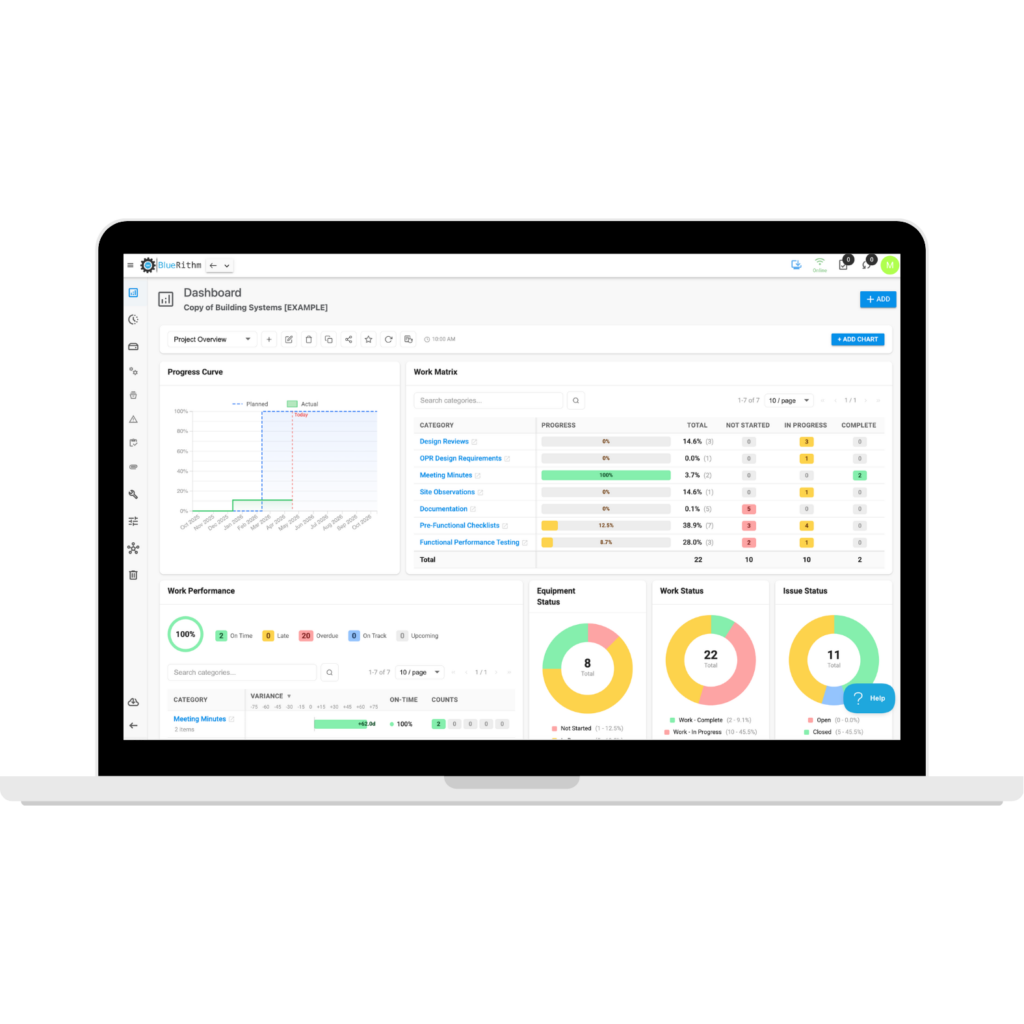
At the core of this release are two powerful options: Project Dashboards and Portfolio Dashboards. Project Dashboards pull data from an individual project, making them ideal for tracking real-time progress, monitoring performance, following milestones, and creating high-level status overviews for project teams, leadership, and clients. Portfolio Dashboards take that same visibility and extend it across groups of projects—or even all projects on an account—so firms can roll up data across regions, offices, clients, campuses, airport programs, chain store portfolios, and more.
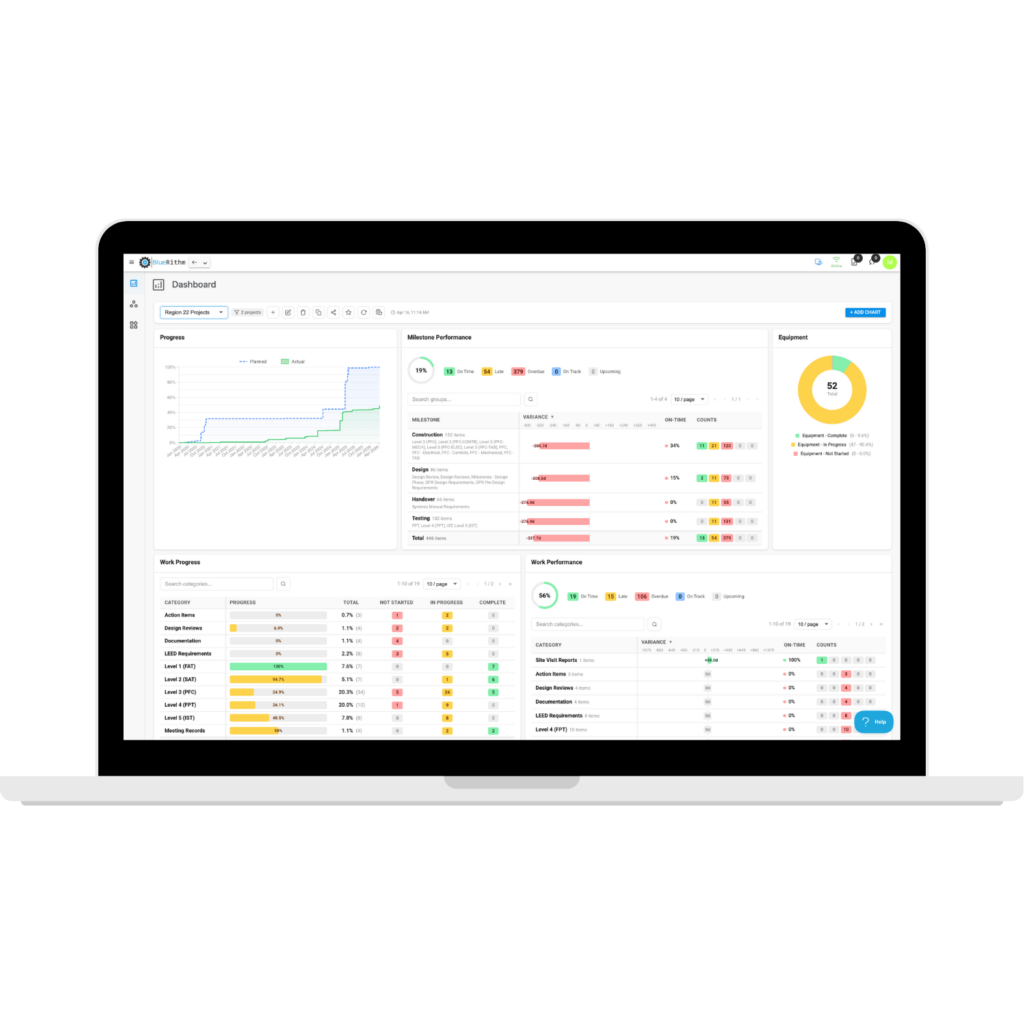
For firms managing multiple active projects, this matters. Instead of hunting through individual jobs to understand overall performance, Portfolio Dashboards make it possible to see trends and status across the business in one place. That makes them especially useful for multi-office firms, organizations serving a large client across many sites, or teams overseeing repeatable project programs such as campus, airport, or retail rollout work.
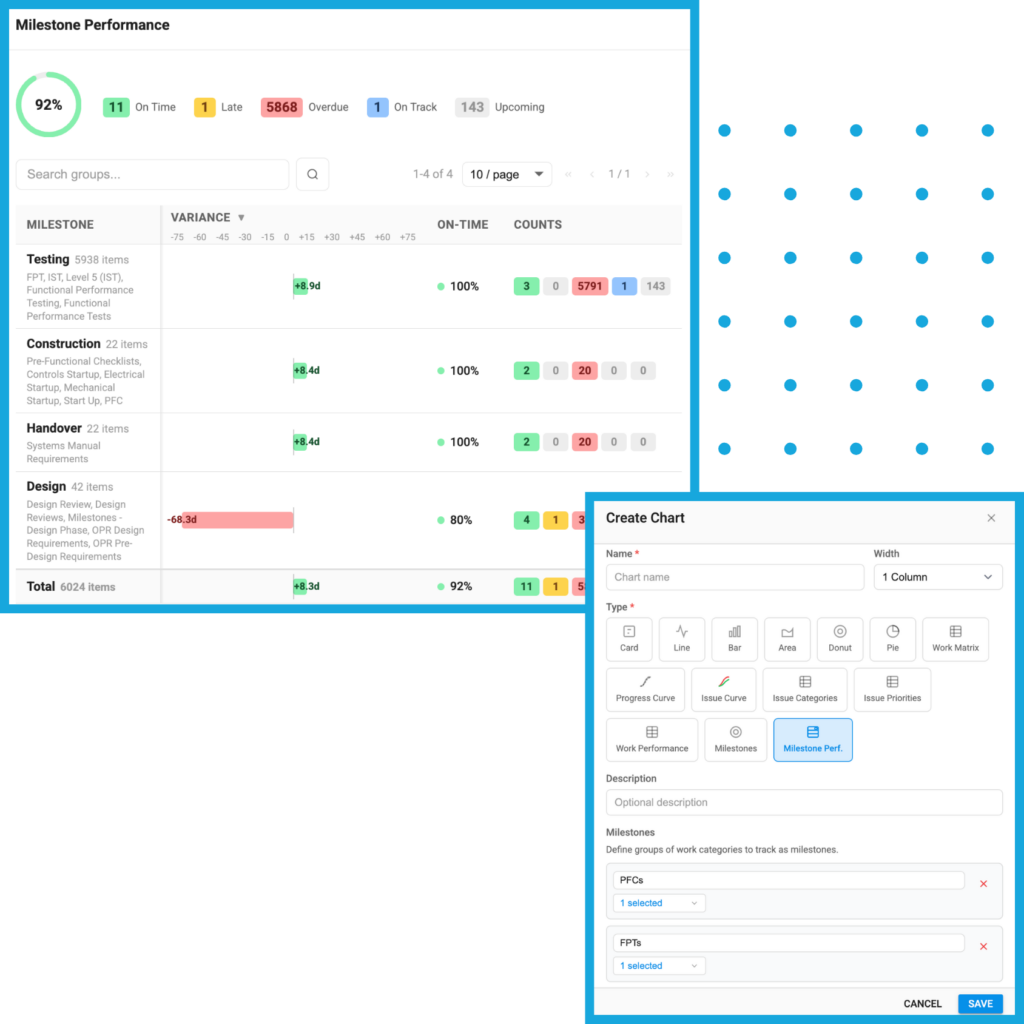
The dashboard experience is intentionally flexible. Users can add and customize charts, arrange them with drag-and-drop controls, and tailor each dashboard to the metrics they care about most. It’s a new way to create your own personalized dashboards, with chart options designed to help teams track progress, performance, and milestone completion in real time.
That flexibility is important because different stakeholders need different views. A project manager may want a weekly operational snapshot. A principal or executive may want a quarterly leadership view. A client may want a concise milestone-based status report. Bluerithm’s dashboards are designed to support all of those use cases by making it easier to build high-level overviews for leadership, planning, quarter-by-quarter reviews, and week-to-week execution.
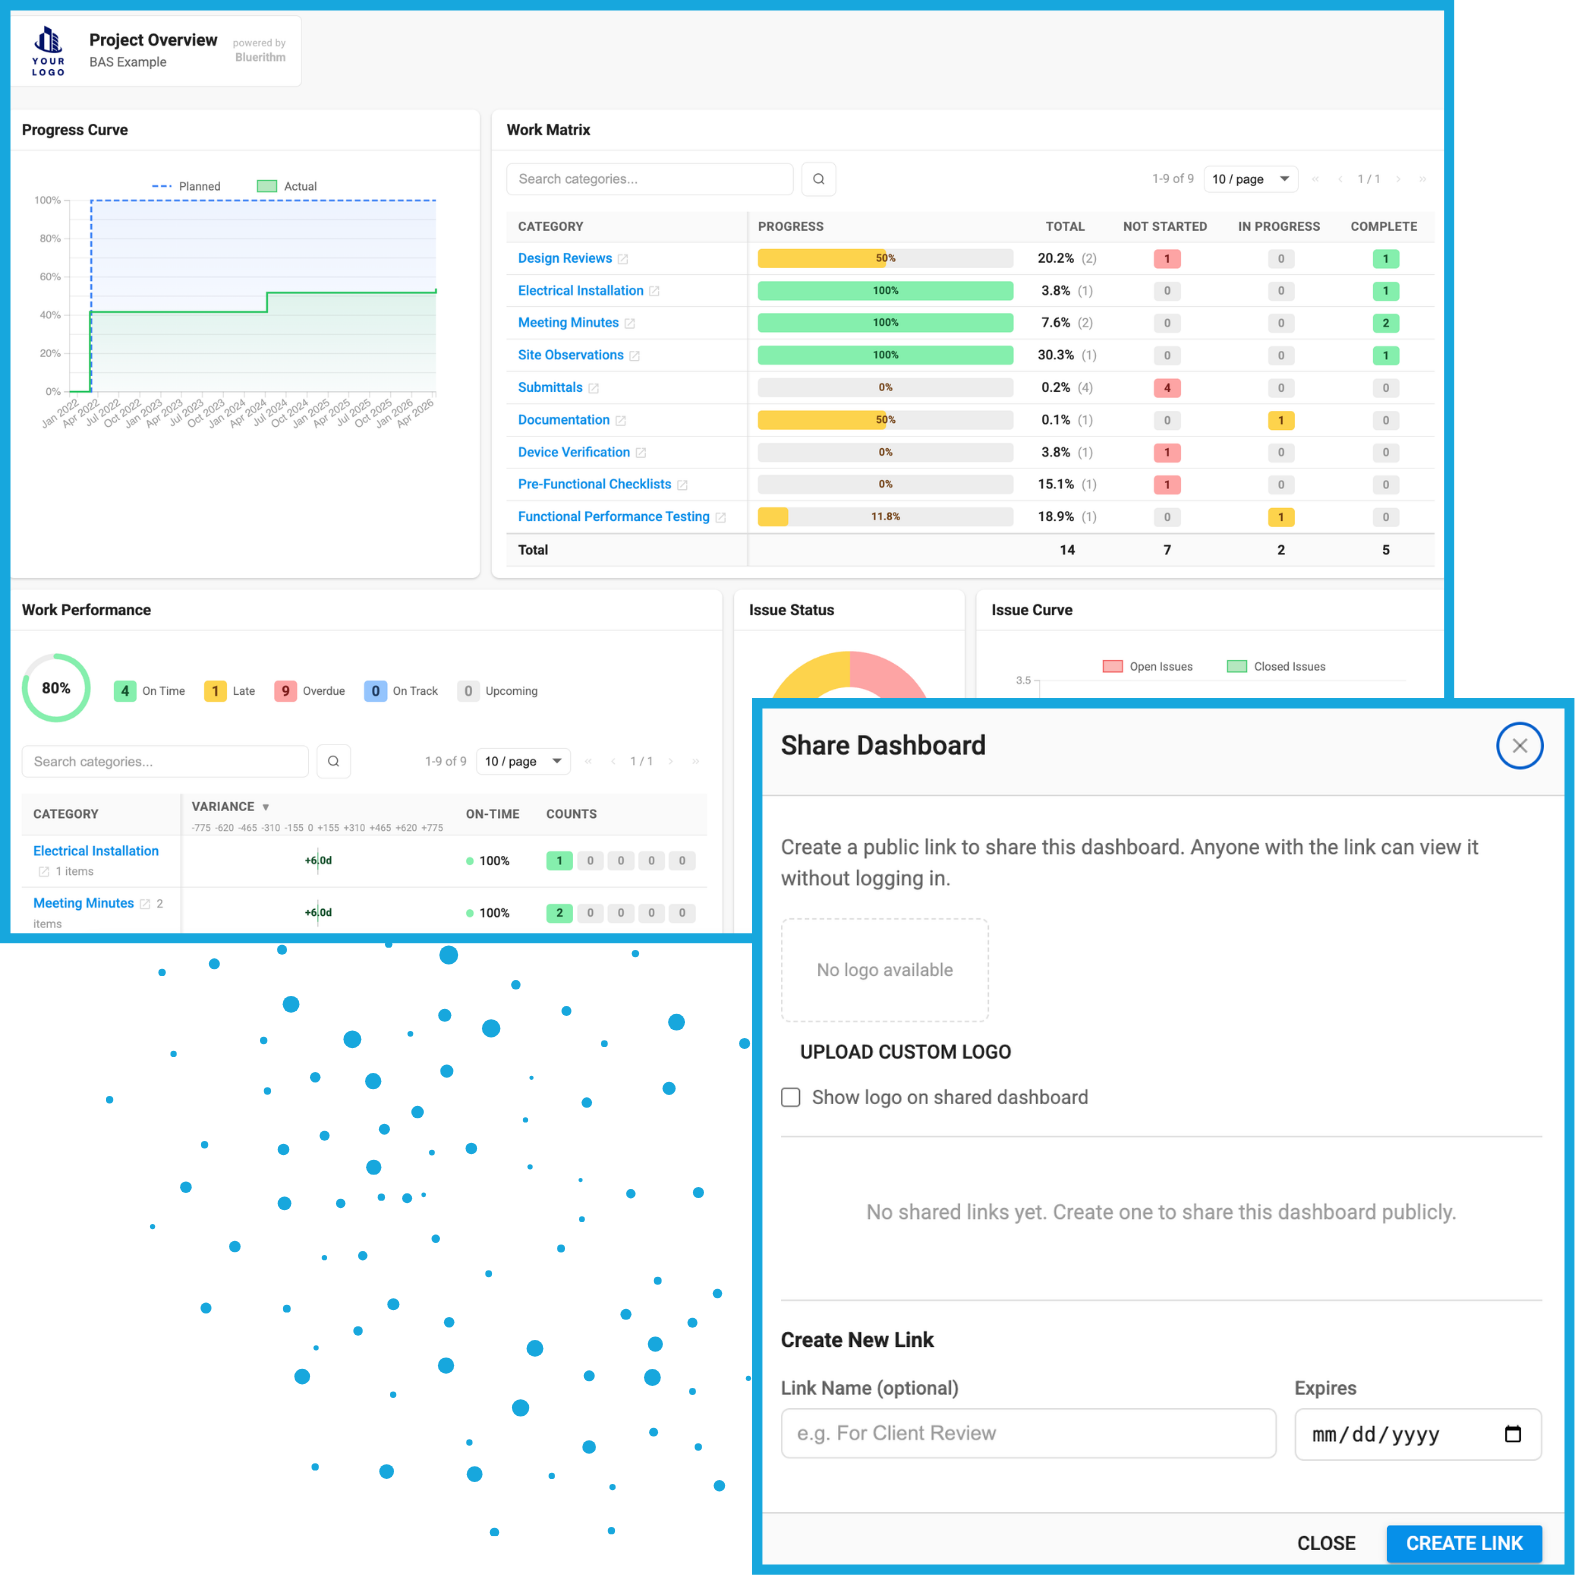
Another standout feature is dashboard sharing. Teams can create shareable public links for dashboards, apply custom branding, and even set expiration dates for those links. That makes it easier to present polished, client-friendly dashboards externally while maintaining control over access. For firms that regularly provide status updates to owners, leadership teams, or outside stakeholders, this can simplify communication and reduce the friction of manual reporting.
Bluerithm’s dashboards are not just about visualization—they are about better decision-making. With real-time project data organized into customizable views, teams can spot bottlenecks sooner, measure progress more clearly, and keep stakeholders aligned without building reports from scratch every time. The result is a more transparent commissioning process and a more efficient way to communicate what is happening across projects.
Whether you want a detailed dashboard for a single project or a rolled-up view across an entire portfolio, Bluerithm’s new dashboards are built to adapt to the way your team works. They bring together customization, clarity, and shareability in one place—helping firms turn project data into actionable insight.